Performance
Performance Stats with Trades
66.83% % Winning Trades
94.70% Average Return Per Trade
25 Average Trades Per Month
$5,693,452 Net Profits
The OptionsHawk Trade Book (“Portfolio”) will be utilized for tracking trade ideas for the OptionsHawk service. Please note this is a mock portfolio and you are responsible for you own trades and must understand the risks involved with trading. We are not registered investment advisors and these should be seen as for education/informational purposes only as we study our approach and track results of our strongest ideas based on our trading process. Please see the Subscription Agreement and Legal Disclaimer parts of the site for further detail.
The desired allocations will be 75% Equity and 25% Options. Withing the 75% Equity we will target 70% to core equity swing trades, 20% to small cap growth and 10% to insider value. These Equity trades will be Trading Hub Live trades with live entry and exit. The core equity swing portfolio will consist of a maximum of 15 positions with around 3% portfolio weightings, the small cap growth portfolio with maximum 10 positions with around 1.5% total portfolio weighting, and the insider value at maximum 5 positions with 1.5% total portfolio weightings.
Within the 25% options allocation we will target 75% allocation to Spotlight Trades and 25% to Event Driven trades which includes Earnings Flow Trades and Earnings Snapshot Trades. The Spotlight Trads will consist of a maximum of 20 trades open, so optimal allocation in the $45,000 to $55,000 per trade, or 0.8% to 0.9% of the net portfolio. The Earnings Flow trades will be allocated at $5000 to $7000 per trade, so 10 to 15% of a spotlight trade. The Earnings Snapshot trade allocations are $10,000 for debit spreads, max risk of $10,000 on credit spreads, and a max credit of $10,000 in straddle sales while stock tied strategies with a max $200,000 stock allocation for risk reversals. The Spotlight Trades are sent with “stop levels” and “targets” though both can be fluid as we are following the market live daily. Members should determine his/her desired stop and target based on individual risk/reward parameters that suits his/her trading strategy and portfolio construction.
Latest Closed Trades
Marriott (MAR) Calls 3/27 242
Mobileye (MBLY) Calls 3/13 383
Alexion Pharma (ALXN) Calls 2/16 65
Vertex Pharma (VRTX) Call Spreads on 2/15 52
Bunge (BG) Calls 2/15 100
Baidu (BIDU) Call Spreads 2/13 60
eBay (EBAY) Calls on 1/26 120
Marriott (MAR) Calls 3/27 242
Marriott (MAR) Calls 3/27 125
Marriott (MAR) Calls 3/27 242
- Spotlight Trades
- Core Equity Swing Trades
- Small Cap Growth Trades
- Insider Value Trades
- Earnings Snapshots
- Earnings Flow Trades
Spotlight Trades
These option trades are sent 2X per week and combine technical research, fundamental research, and options flow analysis to find strong reward/risk opportunities. The trades are generally simply call/put trades but sometimes will incorporate vertical spreads or calendar/diagonal spreads. These are generated from in depth research and pre-set technical alert triggers throughout the week.
Core Equity Swing Trades
These equity trades will be driven off our multi-prong investment research approach targeting names seeing positive options flow sentiment, technical strength, and best-in-class fundamentals. The trades will often be derived from Options Radar highlights and trigger based on technical alert levels set. The stop level of these trades will be determined via technical momentum indicators such as trend lines, moving averages, volume profile and/or ATR stops while the target is fluid with the objective to hold positions longer-term entering at strong reward/risk levels. The goal is to be selective and only feature our absolute best ideas.
Small Cap Growth Trades
These equity positions will be curated from our small cap research, searching for quality small caps exhibiting strong fundamentals with a focus on growth, not value. It will also weight technical relative strength highly and incorporate momentum-based trading. The objective is to own these names long-term but be prudent managing risk as these positions tend to have higher degrees of volatility.
Insider Value Trades
These equity trades will be derived from our monitoring of insider buying in names that often acts as a floor for shares. We prefer to see insider buys in names that also have technical momentum and combine a fundamental and technical approach while being selective and keeping this to a maximum of five rotating positions.
Earnings Snapshots
These are in-depth earnings previews emailed each Sunday during earnings season that can also be accessed at the Trading Hub. It features 3-10 key reports with optimal strategies based on a combination of fundamental, technical, and option flow analysis. The entry prices could fluctuate as they are put together on Sunday and if Monday markets gap, fills may vary. Also, if markets are volatile and the underlying price changes leading up to earnings the strategy may require adjustment, particularly in the complex strategies with defined price objectives. Some of these may be closed before the event if a strong move is made into the report. These trades are to be self-managed and will not be provided “live” entry and exit points. The rules for these trades are $10,000 on debit spreads, max risk of $10,000 on credit spreads, max credit of $10,000 on volatility sales, and max exposure of $200,000 in long stock for risk reversals.
Earnings Flow Trades
These are directional earnings trades posted each morning in the Trading Hub, when opportunities are present, and tied to the daily Earnings Grid which identifies opportunities based on options positioning, skew, implied moves, short interest, and technical while I also apply fundamental knowledge. These are binary option trades, effectively gambling but utilizing all available information to gain an edge. Only take these kind of trades if you are willing to risk 100% losses. These trades are done at smaller amounts and generally target liquid options with near-term expirations. These trades are highlighted in Orange font in the Trading Hub.
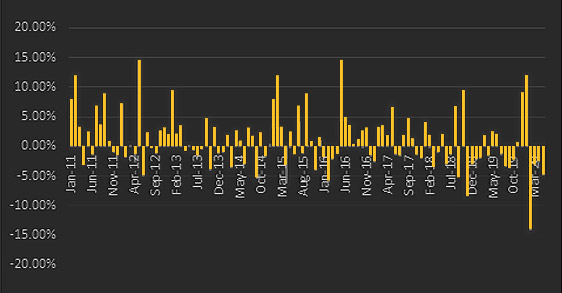
Performance Snapshot
OptionsHawk Mock Portfolio vs. S&P Monthly Alpha
Disclaimers
OptionsHawk performance statistics are based on a mock portfolio with specific trading rules using a Value at Risk (VAR) model. All trades were documented with live entry/exits in live market action, and at prices believed to be accurate. Statistics also do not include costs of commissions. Trading results reporting percentage returns are computed with simple math, and do not factor is risk-adjusted returns for certain strategies that require margin. Due to the time-critical nature of trading in the market, there is no guarantee that every subscriber will see the exact same performance as displayed on the site, and realized outcomes may be more or less depending on the time-lag and trade execution.The performance data is for educational purposes only and the opinions expressed are those of the presenter only. All trades presented should be considered hypothetical and should not be expected to be replicated in a live trading account.
The Options Hawk Trade Tracker is not recommending any investments and is not an advisory service. It is simply a mock portfolio. Note that it is extremely difficult and time consuming to manage an all options portfolio, and options have added risks. It is recommended that you have a diversified portfolio, with no more than 25% of your portfolio dedicated to options trading, or an amount that you are willing to lose. You are responsible for each and every trade you make and Options Hawk is not responsible for any losses due to trades that are presented here purely for informational purposes. After entering a trade you must diligently manage risk and use your own entrance and exit strategies, as each investor has his or her own risk profiles. Due to the amount of time consumed with running this subscription service, I am not always going to be able to follow up on some of these trade ideas and am not required to take positions in any of the aforementioned trades.
HYPOTHETICAL OR SIMULATED PERFORMANCE RESULTS HAVE CERTAIN LIMITATIONS. UNLIKE AN ACTUAL PERFORMANCE RECORD, SIMULATED RESULTS DO NOT REPRESENT ACTUAL TRADING. ALSO, SINCE THE TRADES HAVE NOT BEEN EXECUTED, THE RESULTS MAY HAVE UNDER-OR-OVER COMPENSATED FOR THE IMPACT, IF ANY, OF CERTAIN MARKET FACTORS, SUCH AS LACK OF LIQUIDITY. SIMULATED TRADING PROGRAMS IN GENERAL ARE ALSO SUBJECT TO THE FACT THAT THEY ARE DESIGNED WITH THE BENEFIT OF HINDSIGHT. NO REPRESENTATION IS BEING MADE THAT ANY ACCOUNT WILL OR IS LIKELY TO ACHIEVE PROFIT OR LOSSES SIMILAR TO THOSE SHOWN. All trades, patterns, charts, systems, etc., discussed in this advertisement and the product materials are for illustrative purposes only and not to be construed as specific advisory recommendations.<