Member Guide & FAQ
What is OptionsHawk?
OptionsHawk is a one stop shop for active equity and option traders that provides a wide array of market and individual stock analysis. While maintaining a focus on options trading, and monitoring unusual options activity to piggy-back on the trades of the “smart money”, OptionsHawk also goes in depth into everything a trader needs to trade daily in the markets. Technical analysis, complex option strategies, and original market insight are just some of the features provided on the site, and even a live chat environment during market hours where we provide live coverage of the markets and ample trading opportunities and set-ups.
Why Choose OptionsHawk?
OptionsHawk generally provides more actionable trading ideas daily than any other site in existence, as well as being a full service equity trading “hub”. The live chat feature allows you to trade side by side with me daily and receive content and trade ideas instantly. We find opportunities out there that are unique, and provide in-depth analysis and color as to not only what is trading in the options market, but why it is trading, and how you can trade based on this information and analysis. We have many contacts in the market providing me with actionable news flow on stocks, before it hits the newswires and many other traders, allowing me to provide options activity analysis ahead of competitors.
What’s your trading philosophy?
We take a multi-tiered approach to stock selection and trade structure but above all else we think long-term success in trading starts with the best stocks. There are a lot of junk names that may set up well and make big moves but over the long-term, success comes from rooting out the strongest fundamental stories and riding the trends. We use a variety of valuation metrics to look at individual names, sectors, and themes but ultimately every group is different and there is no universal metric that can be applied (e.g. P/E ratios). That’s why we take the extra time to dive into everything individually, no short cuts. When evaluating a trade, we use the options market to see where the smart money is positioned and incorporate the other techniques like technical analysis to select high probability trades with positive reward/risk ratios.
What kind of technical analysis do you use?
We prefer to look at volume and price and indicators that are derivatives of those two, simple enough. Together, we’ve spent over 20 years looking at various methodologies and strategies and in the end have found that a lot of indicators are 1) more complicated than they need to be; 2) lagging even basic price movements; and 3) have a spotty history at best which many people will massage to fit their own narrative. Things like ‘head and shoulders’ patterns tend to fail more often than they are successful. You’ll find we use VWAP, volume profile, basic consolidation patterns within trends (flags, triangles, etc) and horizontal trendline support/resistance.
Why Options Activity?
Often unusual options activity precedes large price movements in the underlying security, and provides a directional based bias of where a security will be heading. It is not fool proof, and requires years of experience in the options market to get a good read on what activity is significant, and analyzing the activity and how it will impact the security. Unusual options activity often occurs before larger events such as Analyst Meetings, Earnings, News Announcements, Upgrades/Downgrades, and M&A Activity, but can also be a tool to find excellent technical breakouts and breakdowns as many technicians see similar patterns and use the options market to best leverage assets to allow extraordinary returns.
What kind of flows do you look for? What’s notable or unusual?
It really depends on the stock or the flows specifically. You can check out this write-up from 2012 that goes in depth on the “how’s” and “why’s” or specific order flow reading.
Will you tell me what to trade?
No, we are not registered investment advisors. We provide actionable content and analysis but you have to own your own trades. As a provider of a service to hundreds it would be irresponsible to make generalized trades as each person has his/her own style, return goals, and risk parameters. We, instead, provide a full suite of services/products for all types of traders, equity and options. We cover news, analyst commentary, Macro, technical analysis, sentiment analysis, insider trade activity, earnings previews and reviews, in depth fundamental research, as well as our core focus on options activity alerts and analysis. It is fully your responsibility to manage the trades you take.
Will you post your personal trades?
No, I do a lot of trades and it would be extremely time consuming to post and then record these. Also, my position at Relativity Capital would cause a conflict and I am not looking to run into any potential legal issues.
What is the best way to use the service?
First, it is important to familiarize yourself with the site and all the tools/resources we provide. Second, and most importantly, you need to trade your own plan. If you are a short-term trader you want to focus on our technical alerts that align with the options flow direction. If you are a longer term trader focus more on high quality fundamental names we provide research on and the options flow that is positioning in longer-dated expirations. If you are day-trading you want to focus on technical alerts combined with morning options flow and utilize short-term options as to not overpay on premium since you plan on being out of the trade quickly.
There are a lot of options flow posts, which ones do I trade?
Again, this is very dependent on your trading strategy & approach, but a general rule is the larger the trade, in notional ($), the more important, and this relative to the typical trades in the given name (A $200,000 trade in Apple is meaningless, but in a < $1B market cap name, carries meaning). Another rule is I put more weight in positioning that is > 30 days from expiration. Further, names that see repeat activity, so on multiple days, and on multiple strikes/expirations, these tend to be a good sign of larger accumulation and tend to play out with higher success rates. Lastly, it is important to combine fundamentals and technical analysis with the options flow. A name in a strong uptrend that sees put buys is not a reason for alarm, it is often hedging, but a weak name losing key moving averages and/or trend support seeing put buys is likely a bearish signal. Further, call buys in names showing very weak price action are not as meaningful, nor are call buys in names with high and rising short interest. The exception is if there is a clear value-creation catalyst or potential activism.
Also, we do in-depth Options Radar write-ups on 3-5 names each day, these are the names we are curating as the most interesting activity which culls down the selection process if you are overwhelmed. Further, the end of day recap highlights 5-10 of the largest trades each day, deemed most meaningful and high impact.
I am not familiar with options, can I still use your service?
Yes, we utilize options flow signals to identify stocks that will make moves, and often I myself trade the equity instead of the option. We also provide a lot of in-depth write-up on companies that can help you construct a longer-term oriented equity portfolio.
I am a new investor, is your service for me?
Although you could learn a lot about investing and companies with the research we do, our service is more catered to institutional and experiences traders/investors looking for investment ideas. We do not spend a lot of time on education though we have plans to build out our educational content on the site, and may eventually roll out educational videos and content.
How much money do I need to use your service?
There is no standard answer for this question, but I generally have told people an account of $100,000 with a maximum of 25% of account size dedicated to directional options trading is my personal rule of thumb. This again shows the service is not really for new traders and I stress that paying $300/month, although we offer a ton of value, is not smart cost management on a small account size. The $300 is easily recouped the first day by many traders considering even on a $30,000 small stock position, that is just catching a 1% move. If trading a $5000 options position, capturing a 10% gain is fairly easy when combining our technical and options flow alerts, which covers a month of the service quite quickly.
What is the Market Blitz?
Our daily morning note sent every trading day at 7:45 AM. It contains everything you need to get prepared for the trading day ahead including a curated recap of what’s moving markets, International activity including relevant earnings, stock-specific news, full media breakdown of both macro and micro stories, analyst notes, insider activity and more. It also includes calendars of events.
What is the Market Recap?
The Market Recap report is sent every trading day via email at 3:45 PM and includes a full breakdown of the day’s notable options flows by sector. It also includes 4-5 focus pieces called “Option Radars” which are in-depth looks at specific high-impact or unusual trades with potential strategies. Our option radar focus pieces will often look at areas where there has been repeat flows looking out on a 3- to 6-month timeframe. The recap also includes any opening and closing trades in the mock portfolio (MAX members get alerts in real-time).
What is the Weekly Radar?
Our weekend note sent every Sunday morning before 10 AM and packed with everything needed to get ready for the week ahead. It includes a detailed look at S&P technicals and important levels to watch, market sentiment, the most detailed calendar on the Street with impactful events both in the US and Internationally, technical scans, notable open interest and more. In addition, we feature a number of unique research pieces focusing on insider buying, earnings previews, and small-cap deep dives. The weekly radar also includes two trade ideas based off of current open interest.
What is the Monthly Market Brief?
A special report sent around the 1st of the month to members that features a number of unique, longer-form research pieces not necessarily tied to the day-to-day flows but instead looking to catch the next big move. It includes a detailed technical breakdown for the month and longer timeframe outlook including key levels as well as fundamental valuation bands. In addition, it features macro catalysts to watch and a longer-form market sentiment check. In terms of stock-specific information, we feature leading bull/bear flows in an easy-to-read table, 4-5 notable technical setups from quality names, highlight 3-4 ‘radars’ from the month that are setting up well, earnings recap for the month, a deep-dive into thematic trends and the best stocks to play them, a look at a recent M&A deal and potential sympathy plays, small-cap feature, International stock of the month, IPO previews, insider breakdown, and more.
Do you do any other special reports?
Yes, during the year we’ll tackle a number of other longer-form reports. Around June/July, we typically do a 75-100 page dive into the biggest open interest positions for the second half of the year (our “2H OI Report”). We also do a massive 400-500 page preview for the year out around New Year’s Day. Others not on a regular schedule include special circumstances such as the recent bear market where we featured 10 small-cap values, a detailed put sale strategy and potential portfolio, and top fundamental names to target. We’ll also do additional theme write-ups, biotech event previews, and more. All of these are available free to members.
Trading Hub Overview
The Trading Hub is packed with actionable trading ideas every day as I highlight Technical Patterns, Market Moving News, Unusual and Institutional Options Flow, and more each day. Everything is tradable depending on each individuals trading style and risk profile. Throughout the day I will highlight trades in Blue Font as trades that are added to the Options Hawk Mock Portfolio, for educational tracking purposes. Spotlight Trades are sent via email, twice per week, and subject to the entry price noted in the report, so no need to post live in the chat, but take into account the “tape” when entering for the best entry points. Spotlight Trades will not always fill due to market gap opens, and stay as open orders for a week, unless targeting a specific catalyst that passes. Also, there are plenty of opportunities to “scalp” options intraday based on the flow analysis provided and it is impossible for me to list every trade each day, so the Portfolio is more for the swing trades. I suggest that members do not “blindly” follow all the trades and are selective, also willing to take trades not added to the portfolio. The traders that perform the best at Options Hawk utilize the information and analysis provided to make trades daily, using his/her current trading style to determine the trades that align with your trading views on a particular stock. Options Hawk should be seen as an idea-generation platform, NOT a trade recommendation service, and I provide all the insight needed to make better trading decisions, whether via the Market Blitz in the morning, or the daily note on key Technical break-out alerts, options flow, and fundamental analysis. Each trader must take responsibility for his/her trades and it is not possible for me to know each person’s reward/risk profiles, so I provide targets/stops based on my trading style, but this may differ with yours and it is important to take that into account when deciding to enter/exit trades taken. Please feel free to contribute to the Trading Hub with market related content as it is beneficial to the group, and I want to create the best platform for traders, and team-work is essential.
Important: Do Not Copy and Share Content from the Member-Only Page. I provide original content and spend a lot of time doing research, and passing along this information to others for free is a violation of your subscriber agreement and will result in termination without refund. Keeping this content exclusive to members gives it much more value.
Video Discussing Product Features:
A few projects down the road that will take some time to implement include:
1) Dedicated pages for 1000 top optionable stocks with option statistics updating live, volume and OI graphics, and include any recent mentions of Options Action and other content in the chat room. This is going to take some time as I need to get certain licenses, exchange feeds, and an advanced programmer to put the full idea to work, but I have a great vision that should make this a very valuable source of info.
2) User Portolios – Allow for users to keep portfolios of up to 50 stocks that will then alert them via text, email, or other format any time there is a mention in the live trading chat.
3) Hawk Option Scanner and Database Improvements – We are working on developing an automated options scanner with advanced logic, and building out the historical database of notable option trades. This will include pre-set filters and custom scans I create with a front-end user interface. I also plan on creating customized metrics on advanced options data, creating cool visualizations and indicators, and running back-tests and analysis for forward return insights.
4) Custom Chat – I am working on developing a custom chat that will be more advanced with robust features such as dynamic search, alerting, category tagging, window pop-out, scroll-over charts/quotes, private messaging and more.
5) Hawk Research Portal – I am building out a vast research hub all the way from the Macro level down to Stock Specific and everything in between. It will include Trend/Thematic research, customized stock screens, technical screens and indicators, and much more.
6) The longer term vision is to create a full platform that includes our live market coverage along with the research components so you can have all of our information and advanced data on the same screen through the day.
These are a few ideas I have for now and always feel free to contact me with any ideas you may have, as the goal is to make the site as feature-rich as possible, while also keeping a focus on the daily market coverage.
Recommendations:
Trading Books:
Jeff Augen (“Trading Options at Expiration”, The Volatility Edge”, “Day Trading Options”)
McMillan (“Options as a Strategic Investment” – Top Starting Book)
Kahn (“Technical Analysis: Plain and Simple”)
Shannon (“Technical Analysis Using Multiple Timeframes”)
Sinclair (“Options Trading: Pricing and Volatility Strategies and Techniques”, “Volatility Trading”)
DeMark (“DeMark on Day Trading Options”)
Schwager (“Market Wizards”)
Websites: A List of Options Related Websites and Educational Online Resources are on the OptionsHawk Website.
Daily Resources:
· ThinkorSwim Trading Platform: Prophet Charts and TOS Charts for Technical Analysis, Analyze Function to Diagram Strategy P/L, etc., Multiple Watchlist Broken by Industry, Top Optionable Liquid Names, and Top 2,000 Stocks, Alerts.
· Google Reader for RSS Feeds: I use this for most of my news with the Business Wire PR Directly Fed Through Here, as Well as Useful Sites from Around the Net (WSJ, Business Week, FT, Barrons, DealBook, LA Times, Chicago Tribune, NY Post/Times, DigiTimes, Seattle Post, Houston Chronicle, Etc.). The daily news/chatter is from my trading contacts passing information via AOL Instant Messages. (TradetheNews, Briefing, Street Insider, Street Account, FlyontheWall are the most popular wire services, and in that order for best to worst, but I do not use any of those services)
· FinViz: Prefer to Use FinViz for Screening (Fundamental and Technical Screens) as Well as HeatMaps, and a ton of other resources offered on that site, a must-use in my opinion
· Custom Option Scans: The scans provided on the Member Page at the Bottom are a Key Resource in Finding Much of the Day’s Unusual Activity. I also use the LiveVolPro program where I have set up many custom scans and also scan for trades coming through my watchlist. Bloomberg, if you have access, also has plenty of great functions to breakdown options activity.
· Twitter: You can follow me on Twitter via @OptionsHawk ( https://twitter.com/#!/optionshawk) and also see who I am following. There are many great traders and information providers, and anyone I am following is a good place to start. I use TweetDeck which is handy and posts small notification messages in the corner of your screen along with audio alerts when there is a post.
· Analyzing, Portfolio Tracking, Strategy Screeners, Etc.: I use Optionistics.com for some of their resources, although usually just at night doing scans. This site (http://www.avasaram.com/) also has some useful strategy screeners for free. There are also some free Option Rankers here (http://www.optionetics.com/market/rankers/default.asp?freeRanker=yhhrankperc)
· Street Events: Used for Earnings Dates, Conference Dates, Analyst Meetings, Conf. Calls, Etc.
What is the Trading Hub?
The Trading Hub is an internal page for MAX members with everything we put out in one convenient place including the live chat during market hours. It includes links to our Market Blitz, daily radar write-ups, spotlight trades, research, and more. It also includes links to essential trader tools.
Where can I find options activity for XYZ stock?
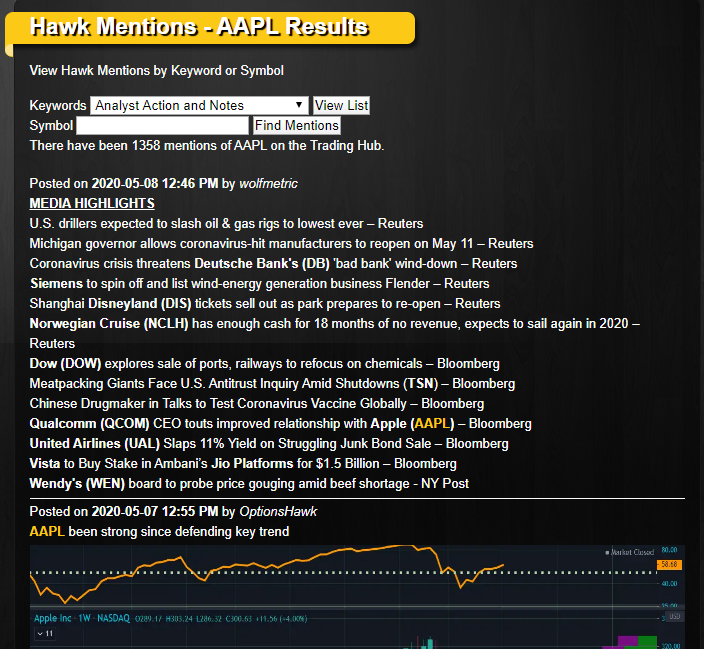
For MAX members, the easiest way to find options flow for a specific stock is to go to the Trading Hub and in the right-column select “Hawk Notable Trade Database.” This opens up our daily spreadsheet with all of the options flow we track on a daily-basis, more than 200 adds per day. On this sheet, you can filter out to specific stocks or ETFs. MAX members can also look at the Archives in the top middle of the page. In the search-bar for symbol, type in the ticker you want, click “find mentions” and it will open up a new page with all of our mentions for that ticker including news, charts, and options flow. For example, searching for AAPL:
What is aggressive buying?
Aggressive buying is when trades execute either on the offer of a wide spread or even above the offer and theoretical price, often leading to a sharp rise in IV. It can sometimes represent ‘sloppier’ trades where a buyer is interested in getting in at any cost.
What is a stock replacement?
Often we’ll spot blocks of options that trade in replacement of an existing stock holding. It’s impossible to know exactly why a trader is doing a stock replacement but often someone will reduce their overall exposure in a name that’s run, especially in front of events – taking profits and keeping on a runner for exposure. For example, a trader may sell 50,000 shares of stock for $50 and buy 2,000 January calls for $1, taking their overall exposure from $2.5M to $200,000. Another popular trade is selling puts as a stock replacement, again reducing overall exposure and booking profits while clearly defining when and where you’ll buy back the stock.
What is a buy-write?
A buy-write is when a trader sells calls against a new long stock position, defining a level where they’re willing to be called away while generating some smaller, incremental income from the short call position. For example, a trader may sell 1,500 calls around 35-delta against 60,000 shares of stock.
Why do you say some trades ‘likely trade with stock?’
One of the more common trades we see are spreads that sell calls and buy puts which is a very commonly recommended sell-side strategy for protecting gains in stronger stocks. Differentiating between when that trade is a protective collar or an outright bearish trade takes some common sense and knowledge of the specific stock and we’ll highlight between the two live during the session.
What is L2?
Often, you’ll see us refer to L2 which is short for level two quotes. L2 is the order book for the option at the time it is traded with a complete picture across all exchanges, bid-ask, NBBO, and other market participants. L2 gives added insight into where a trade executed. For example, an option may execute near or at the offer price but be sold to open as L2 shows it being offered out for sale.
What is theoretical value?
Options are priced in a very specific way looking at a number of inputs like implied volatility, time to expiration, dividends, interest rates, underlying price and more and this establishes a theoretical value for the option. The problem is that posted bid-ask spreads often don’t represent the true market and can be misleading. For example, a call option may trade at $5.30 on a 5.30X5.40 spread and look to be sold. But, the theoretical bid/ask at the time of trade may actually be 4.50X5.90 and thus trading above the mid of 5.20 and more likely bought to open. Another example is seeing calls execute on the offer when the spread is actually far wider than posted. For instance, you may see four 100 lots of OTM calls trade at $9.40 on a 9.00X9.40 spread and look bought to open. However, the bid-ask at the time was 8.90X10.30 and thus they executed well-below the mid. When used in conjunction with L2, implied volatility, and other factors, the theoretical price can get a more accurate picture of how an option traded.
What is a VPOC?
A VPOC is a ‘volume point of control’ and a key part of volume profile analysis. Simply put: It is the most commonly traded price within a certain timeframe and the area where buyers and sellers were in balance. We often use YTD VPOC or monthly VPOCs as key reference points and levels of interest for where price may trade back to and bounce as they often act as magnets. Sometimes it is referred to as a ‘virgin point of control’ but that is more specifically a VPOC that hasn’t been tested since it formed. These are important because the market has yet to test whether or not this is still accepted as value.
What is a value area?
The value-area is simply the area where the majority of trading volume occurred during a specific time-period. It usually is pre-set as 70% on most platforms and is one standard deviation above and below from the VPOC. When a stock moves above or below value, it often migrates further up or down to the next value area or even VPOC as price discovery is looking for acceptance. Another common strategy is the 80% rule which says that if a stock opens outside of value and trades back into it for 1-2 bars, it has an 80% chance of filling the value area.